(Gross Yields from 9.2%, $146 Average Daily Rate)
Quick Facts
Population – City of Phoenix – 1,608,139 (2020), Marciopa County – 4,420,568 according to US Census Bureau
- MacroTrends states that Maricopa County is currently growing at a rate of 1.48% annually since 2021. As a benchmark, FreddieMac states that US cities grow at an average 0.3%.
- Famous for its sunny weather and impressive beaches
Cost of Living: Payscale ranks the cost of living in Phoenix to be 5% lower than the national average. Phoenix also has 5% lower housing expenses than the national average.
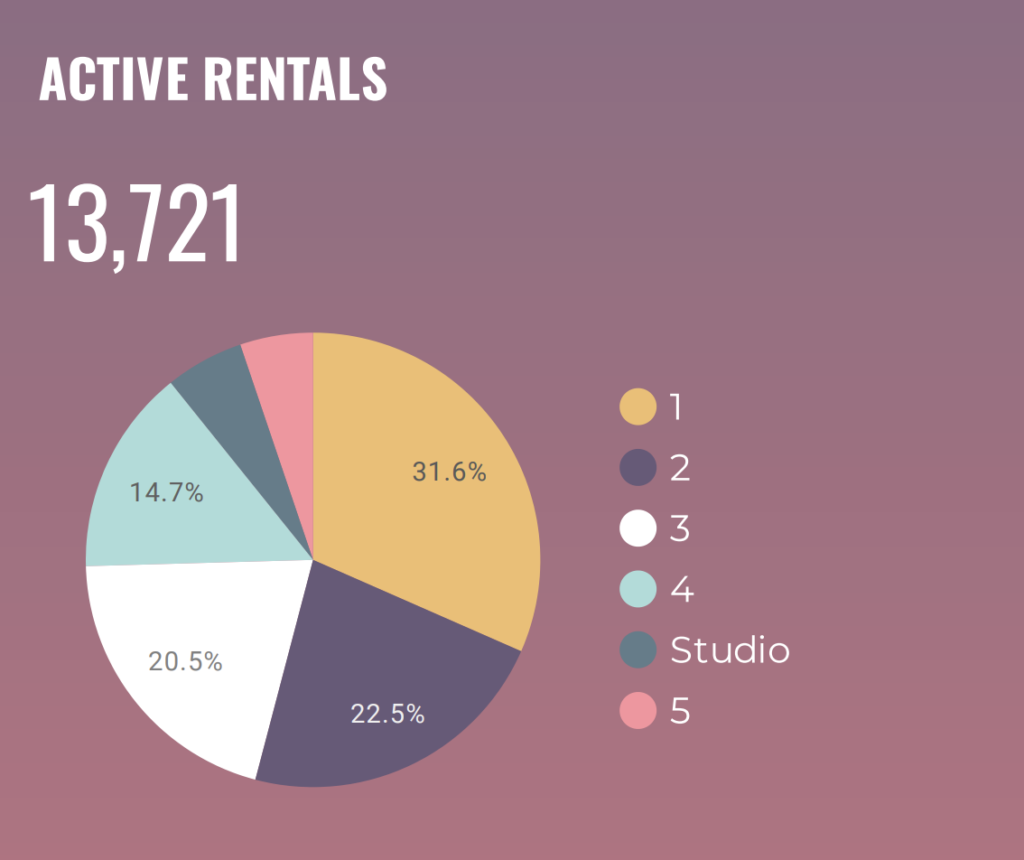
Active Rentals
There are 13721 active rentals in Maricopa County. Almost 53% of all listings are 1 and 2 bedrooms. Larger homes catering to bigger parties and families are potentially undersupplied. There are only 539 active studio homes.
Average Daily Rate (Nightly Price)
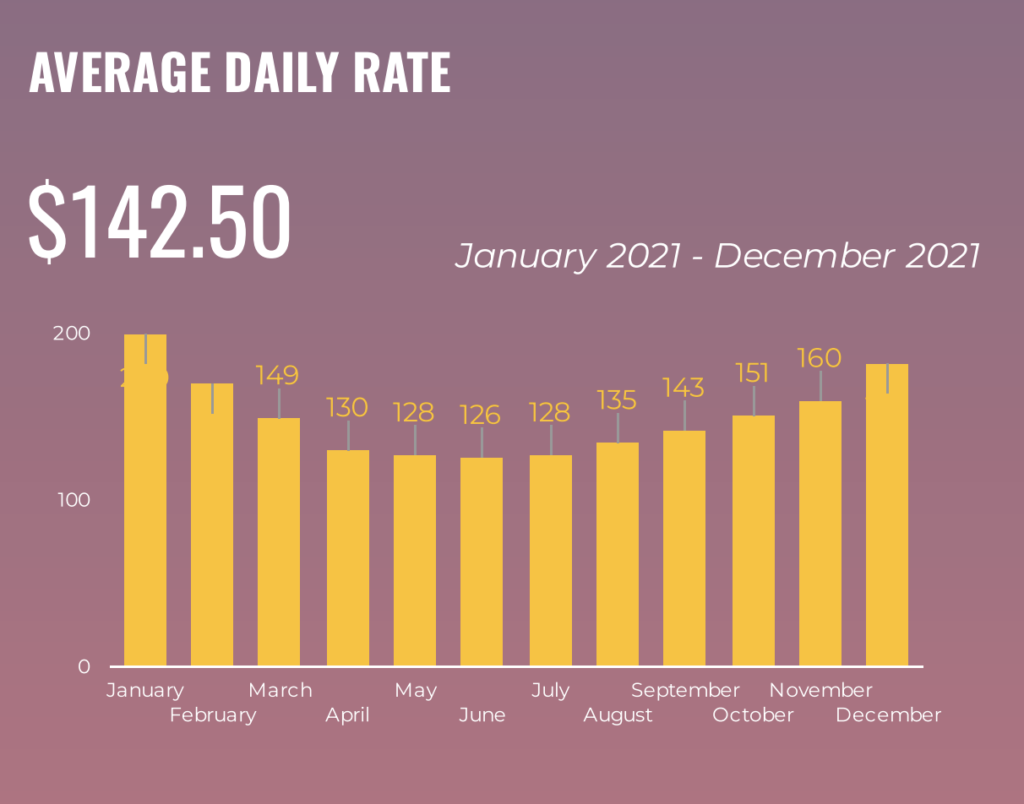
The Average Daily Rate for rentals in Maricopa County is $142 dollars. Throughout the year, the rate fluctuates by $58 from that average with the highest Average Daily in January ($200) and the lowest in June ($126).
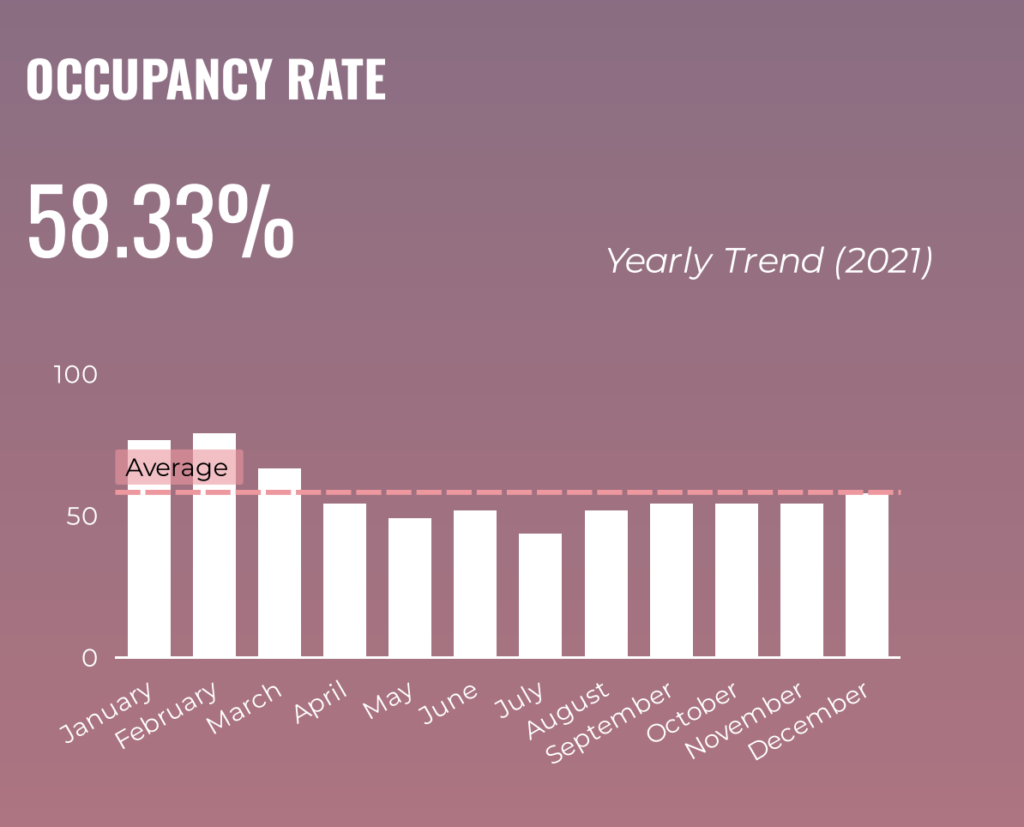
Occupancy Rate
Occupancy Rates in Maricopa County, Arizona are the highest in the summer. The Occupancy Rate at an annual level is 58%. The lowest occupancy rate was in July (44%) and the highest was in February (80%). Drop-in occupancy rates in January and December of 2021 can be partially explained by a surge in COVID cases.
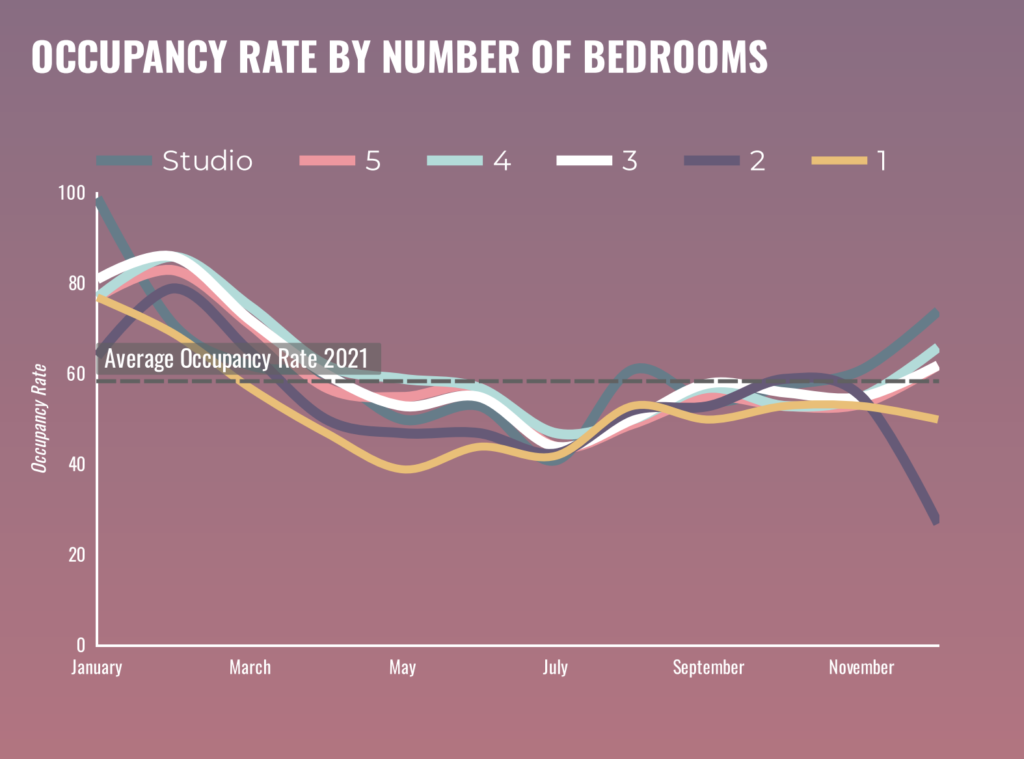
Occupancy Rate-Per-Bedroom
The average occupancy rate is the highest for Studios and 4 bedroom homes, 62% and 62% respectively.
Monthly Revenue
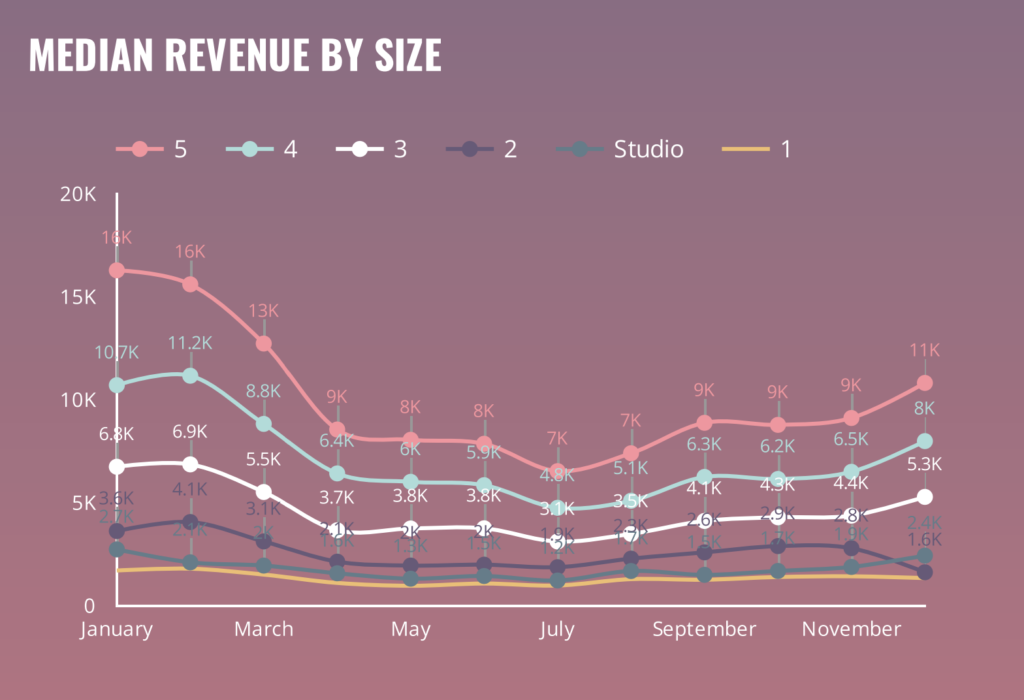
The median revenue is the highest in February $4210 and the lowest in July $2060. Throughout the year, monthly revenue fluctuates the most for 5 bedroom homes and the least for 1 bedroom homes. More conservative investors should look into 1 bedroom investment properties as data shows they are the most stable and predictable.
More risk-tolerant investors should consider investing in Studios. Inventory is low for studio homes yet they consistently make more revenue. There is an opportunity to analyze the small number of studios’ properties and beat the competition.
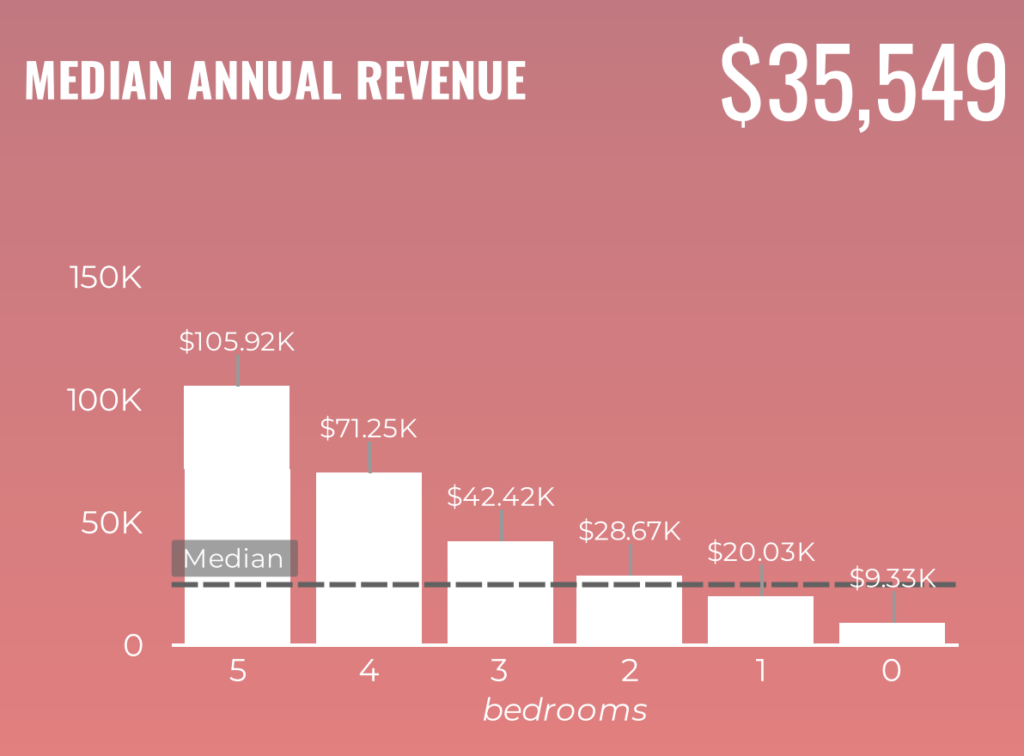
Annual Revenue
Short-term rentals in Maricopa County generate a median revenue of $35,549 annually. The highest median revenue for rentals in Maricopa County is for 5 bedrooms at $105,920.
High-Performance Properties
Chalet’s research shows that 4 bedroom homes have the highest percentage of homes in high yield territory (12.07%) therefore could be a good strategy for this market. Studios do not have enough samples to be considered (no active listings).
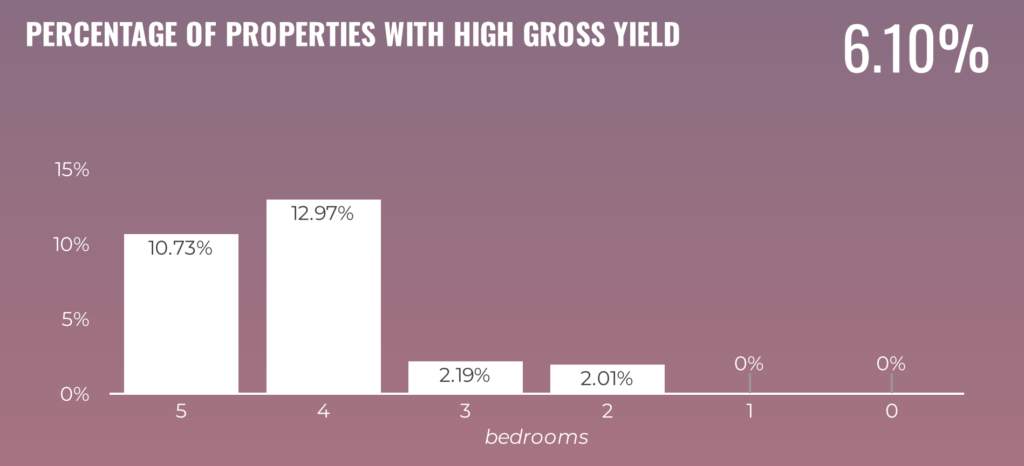
Chalet considers properties with a gross yield greater than 15% as high yield properties. Gross yield equals Gross Income/Purchase Price
Median Gross Yield
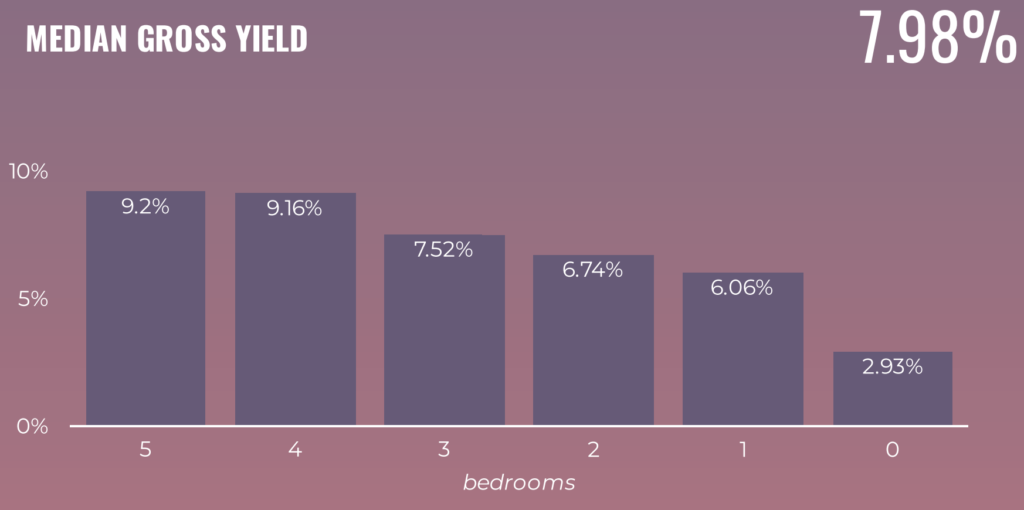
The median gross yield for homes in Maricopa County is 7.98%. 5 bedrooms have the highest median gross yield (9.2%) followed by 4 bedrooms (9.16%) and 3 bedrooms (7.52%).
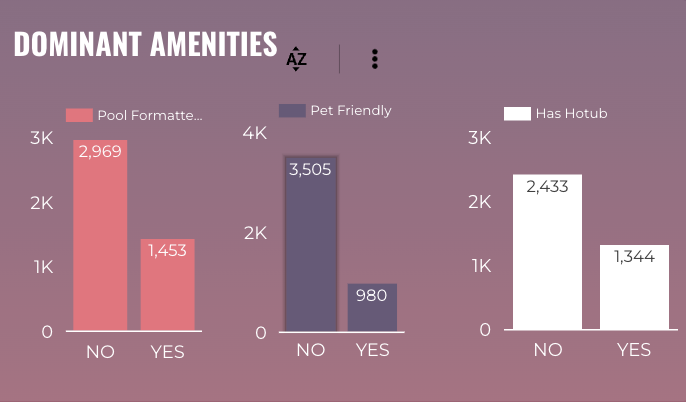
Supply
There are 1453 active properties have a pool and 980 properties are pet-friendly. Chalet sees the potential opportunity for new investors to stand out by making their property pet-friendly. Surprisingly, 547 listings do not charge a cleaning fee. The average rating is 4.75, the largest host is WanderJaunt, and the market is dominated by property management firms.
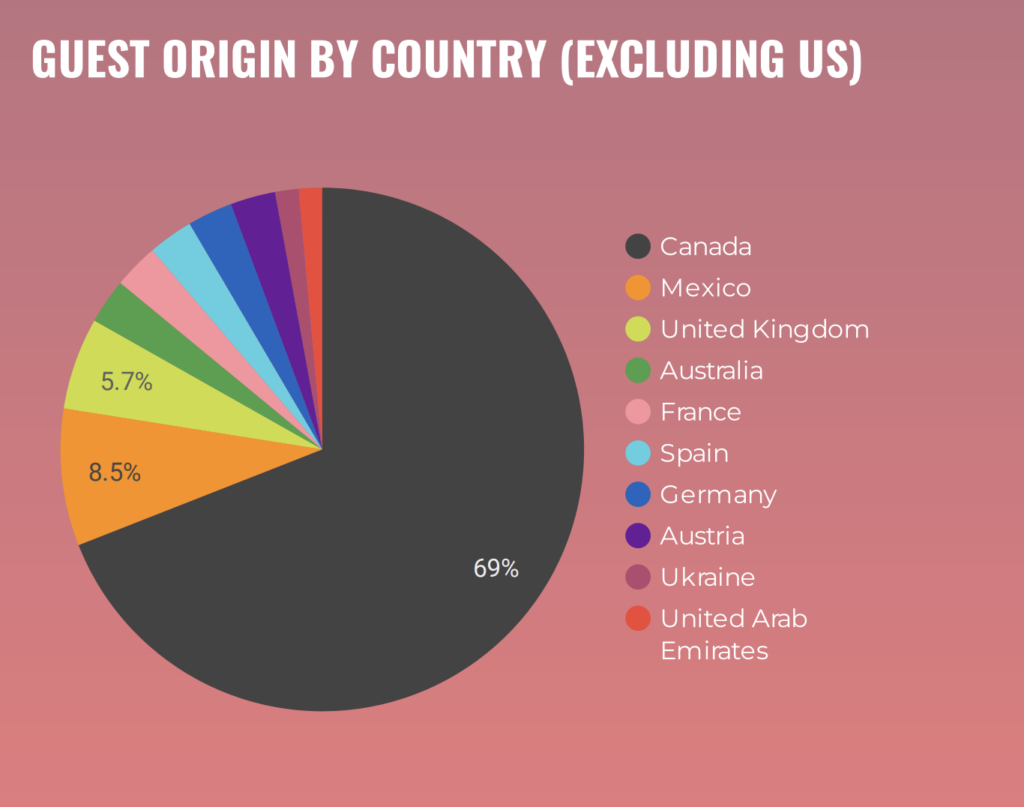
Demand
The majority of the Maricopa County short-term rental guests are domestic guests from the United States, though February is when the presence of international guests is most noticeable. However, international guests in February barely crossed the 5% threshold of total guests.
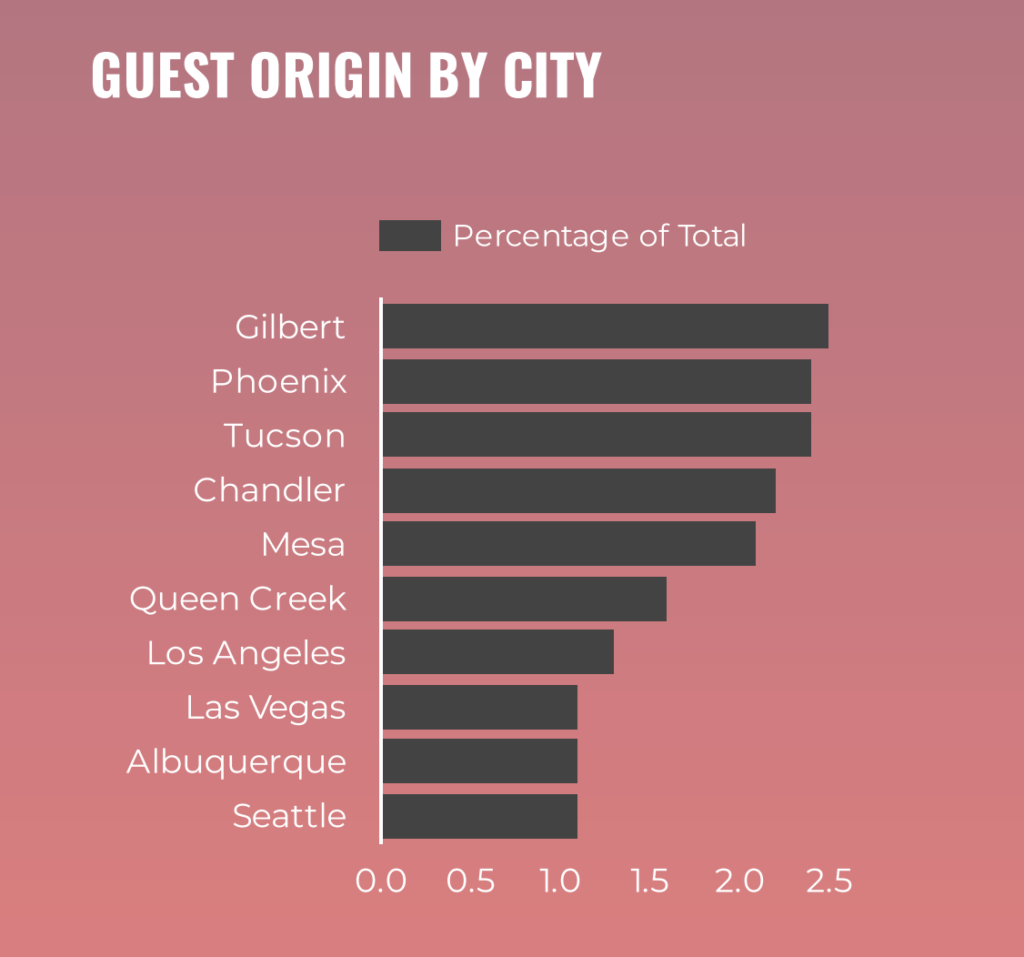
The majority of Maricopa County guests come from U.S. cities located within driving distance. Almost 25% of all guests in Maricopa County are from Maricopa County. We expect drive-to locations/cities to continue to do well in the post-covid world.
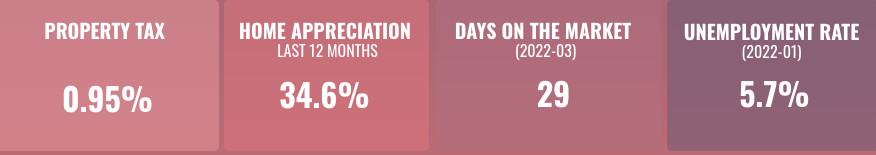
Other Facts
Maricopa County has an effective property tax rate of 0.610%. That’s slightly lower than the 1.07% national average. Source: SmartAsset.
According to Zillow, homes in Phoenix appreciated 29.5% year-over-year (YoY) and the median home price for active listings was $404,405 (as of March 2022).
Homes in Maricopa County average just 28 days on the market according to Redfin.
The BLS reported that the unemployment rate in Maricopa County fell to 3.1% in February of 2022, which is lower than the national average of 3.6%.
Short-Term Rental Regulation
See Chalet’s detailed analysis of short-term rental regulation in Maricopa County.
Ready To Start Your Investment Journey?
Data Methodology
For this guide, we analyzed everything from public data sources, recently sold homes, data from the Bureau of Labor and Statistics, Airbnb data, and more. Chalet ran this data through machine learning models to derive the forecast models with the most accurate predictions.
Glossary
- ADR: Average Daily Rate
- Gross Yield: Median Revenue/Median Home Price
- Price To Rent Ratio: The price-to-rent ratio is the ratio of home prices to annualized rent in a given location. This ratio is used as a benchmark for estimating whether it’s cheaper to rent or own property. The price-to-rent ratio is used as an indicator for whether housing markets are fairly valued, or in a bubble according to investopedia.
Thank you for reading. If you are interested in investing in Maricopa County, schedule a free consultation with one of our experts.