Last updated: July 2025
The short-term rental (STR) market has changed dramatically in recent years. High mortgage rates, shifting regulations, and changing guest preferences have all impacted investment potential. The question is: where should you invest in 2025?
At GetChalet.com, we analyzed hundreds of U.S. markets, using data from Zillow, the Bureau of Labor Statistics, Google Trends, and our proprietary Short-Term Rental analytics to create a data-driven roadmap for investors.
This year’s Top 15 Short-Term Rental (Airbnb) Markets for 2025 report highlights the cities and towns poised for strong cash flow and long-term appreciation. Below, we’ll explore key investment trends and highlight some of the most promising markets from the list.
But to get the full breakdown—including detailed market metrics, revenue projections, and investment strategies—download the complete report.
Why These Markets? Chalet’s Data-Driven Approach
Choosing the right STR market requires more than just following tourism trends. A successful investment balances cash flow, appreciation, and regulatory stability.
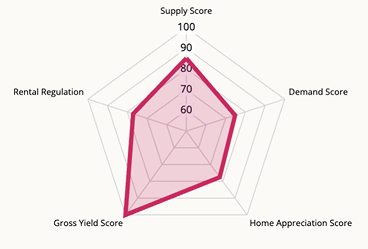
Our rankings are based on five key factors:
✔ STR Performance (30%) – Median revenue, occupancy rates, and ADR (average daily rates).
✔ Regulatory Environment (20%) – Licensing requirements, zoning laws, and investor-friendly policies.
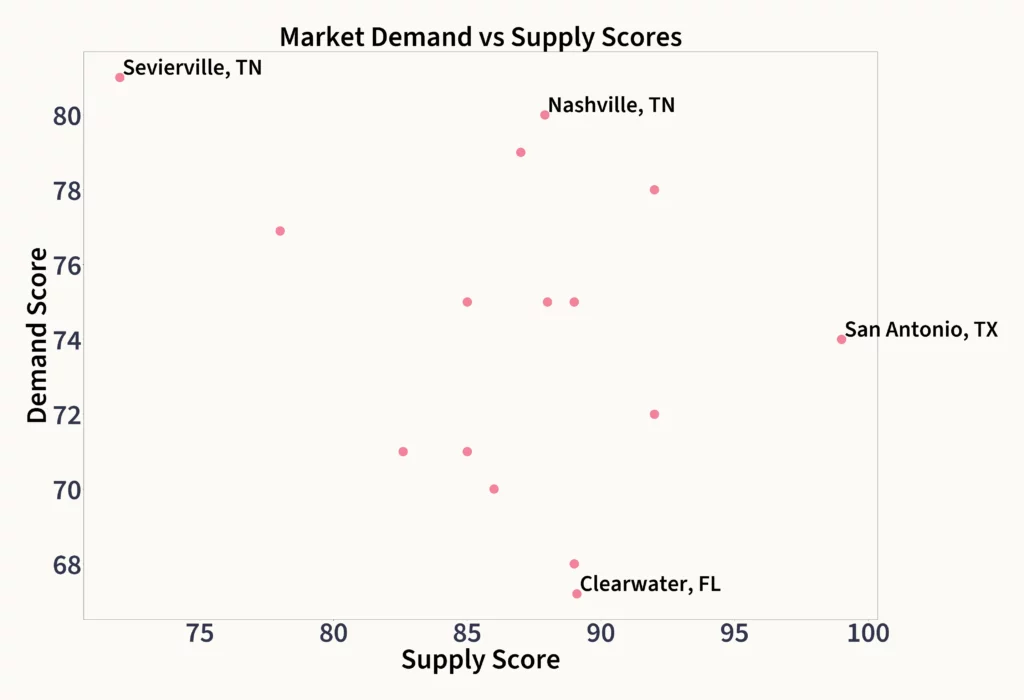
✔ Demand Indicators (20%) – Tourism trends, event calendars, and Google search data.
✔ Supply Trends (20%) – Market saturation, new listings, and deactivation rates.
✔ Real Estate Fundamentals (10%) – Home affordability, appreciation potential, and equity growth.

2025 STR Investment Trends: What You Need to Know
Before diving into the Top 15 STR Markets, let’s explore key trends shaping investment decisions in 2025.
1. Affordable Markets Lead the Way
2. Revenue Growth in Stable Markets
📈 The top 15 STR markets are projected to see a 3% average annual revenue increase in 2025
📈 Markets with rising ADRs and stable occupancy rates will outperform the national average
Investors should focus on markets where nightly rates are climbing while occupancy rates remain steady.
Example: Columbus, OH has an ADR of $170.94 and a steady 54.2% occupancy rate, making it a reliable income market.
3. Inventory Trends: Pricing Power vs. Competition
🏠 Some high-performing markets have declining STR supply, giving investors pricing power.
🏠 Others are seeing moderate inventory growth (13% or less), keeping competition manageable.
Markets with low supply growth and high demand offer the best revenue potential.
Example: Sevierville, TN (Smoky Mountains) continues to see rising demand for cabin rentals, driving higher ADRs and occupancy.

4. Amenity Investments Matter More Than Ever
🏡 Properties with premium amenities (hot tubs, pools, EV chargers, pet-friendly features) earn higher ADRs and occupancy rates.
🏡 STR operators who tailor their properties to guest demand will see stronger profitability.
Example: Pigeon Forge, TN cabins with hot tubs and game rooms consistently earn higher nightly rates and occupancy.
- 📊 Which Airbnb rental markets are set to outperform in 2025 based on revenue growth, occupancy trends, and supply shifts.
- 🏡 Where home prices are still affordable while generating high rental income.
- 📈 How to identify markets with strong appreciation potential for both short-term cash flow and long-term gains.

Sneak Peek: A Few Standout Markets for 2025
1. Detroit, MI: The Best Cash Flow Market for 2025
🏡 Median Home Price: $74,213
💰 Median Annual STR Revenue: $31,334
📈 Gross Yield: 41.7%
📊 Occupancy Rate: 55.6%
📍 Rental Regulation Score: 77/100
🏠 Zillow YoY Home Value Change: +9.1%
Detroit leads our 2025 rankings as the highest-cash-flow STR market. With home prices averaging just $75,000, investors can generate significant revenue with low upfront capital.

Why Detroit?
✅ Affordability: One of the lowest-cost STR markets in the U.S.
✅ Strong Appreciation: Home values increased 9.1% last year, with steady growth expected.
✅ Expanding Demand: A growing downtown scene, revitalized industries, and increased tourism make Detroit a rising STR hotspot.
Challenges:
⚠ Moderate occupancy rate (55.6%) – Investors must focus on pricing strategies and premium amenities to increase bookings.
⚠ Regulatory landscape is evolving – Detroit’s STR licensing is moderately complex, but no citywide bans exist.
🚀 Investor Tip: Investors who optimize their listings with business-friendly amenities (e.g., fast WiFi, self-check-in, and workspaces) will outperform the market average.
2. Sevierville, TN: The Best Smoky Mountain STR Market
🏡 Median Home Price: $450,000
💰 Median Annual STR Revenue: $59,975
📈 Gross Yield: 16.2%
📊 Occupancy Rate: 56.5%
📍 Rental Regulation Score: 73/100
🏠 Zillow YoY Home Value Change: -0.4%
Sevierville, TN, sits at the gateway to the Great Smoky Mountains, making it one of the strongest-performing cabin rental markets in the U.S.
Why Sevierville?
✅ Year-Round Tourism: The Smoky Mountains draw over 14 million visitors per year.
✅ Luxury Cabin Demand: Guests are willing to pay premium ADRs ($426+) for well-equipped cabins.
✅ Stable Regulations: While STR permits are required, Sevierville remains one of the most STR-friendly mountain towns.
Challenges:
⚠ Slight Home Price Decline (-0.4%) – While the market is strong, recent price corrections may impact appreciation potential.
⚠ Supply is growing – Competition is increasing, so investors must differentiate their listings with high-end amenities.
🚀 Investor Tip: Cabins with hot tubs, mountain views, and pet-friendly options command higher ADRs and occupancy rates.
3. Columbus, OH: A Stable, High-Growth Urban Market
🏡 Median Home Price: $285,000
💰 Median Annual STR Revenue: $36,085
📈 Gross Yield: 14.9%
📊 Occupancy Rate: 54.2%
📍 Rental Regulation Score: 76/100
🏠 Zillow YoY Home Value Change: +3.5%
Columbus, OH, has emerged as a high-potential urban STR market, thanks to steady tourism, a growing economy, and affordable housing.
Why Columbus?
✅ Economic Growth: Home to Ohio State University and major tech hubs, Columbus has diverse, year-round demand.
✅ High ADR & Revenue: With an ADR of $170.94 and annual revenue of $36,085, Columbus outperforms many urban STR markets.
✅ Appreciation Potential: 3.5% YoY home value growth, with continued long-term upside.
Challenges:
⚠ Occupancy rate is moderate (54.2%) – Investors need strong pricing strategies and mid-term rental options to boost cash flow.
⚠ STR regulations require permits – The city enforces a permit system with some restrictions, though it remains investor-friendly.
🚀 Investor Tip: STRs near Short North, German Village, and Downtown Columbus perform best.
4. Nashville, TN: A High-Revenue but Heavily Regulated Market
🏡 Median Home Price: $514,300
💰 Median Annual STR Revenue: $62,058
📈 Gross Yield: 14.4%
📊 Occupancy Rate: 52.6%
📍 Rental Regulation Score: 60/100
🏠 Zillow YoY Home Value Change: +0.8%
Nashville remains a top STR market, but tightening regulations are making it harder to operate non-owner-occupied rentals.
Why Nashville?
✅ Strong Tourism Base: Over 15 million visitors annually, driven by music, sports, and events.
✅ Premium ADRs & Revenue: STRs in Nashville command high nightly rates, with a $514.30 ADR.
✅ Steady Appreciation: Home values have grown 0.8% YoY, and demand remains strong.
Challenges:
⚠ Strict Regulations – Nashville has phased out non-owner-occupied STRs in many residential areas.
⚠ Occupancy is lower (52.6%) – Investors must focus on differentiation and marketing to maintain bookings.
🚀 Investor Tip: Focus on legally permitted STR zones, such as The Gulch, Downtown, and select areas of East Nashville.
Get the Full Report: The Top 15 STR Markets for 2025
📊 Want to see all 15 markets and full data insights?
This exclusive guide will help you invest smarter, navigate regulations, and maximize STR revenue in 2025.
Final Thoughts: Where Should You Invest Next?
The short-term rental market remains highly profitable, but choosing the right city is more important than ever.
With strong revenue growth, shifting regulations, and changing traveler preferences, a data-driven strategy is key.


